Blog » Industry
KPI Trees for Promotion Effectiveness in CPG
Mar 26, 2026 · 10 min read
How consumer goods teams use KPI trees to decompose Promo ROI into volume, price, and spend drivers, turning trade promotion optimization from guesswork into structured analysis.
The Promotion Problem in Consumer Goods
Trade promotions account for 15 to 25 percent of revenue in most consumer packaged goods companies. Despite this scale, few organizations can answer a basic question with confidence: did that promotion actually work?
The challenge is not a lack of data. Retailers share point-of-sale numbers. Syndicated providers deliver volume and share trends. Internal systems log every dollar of trade spend. The problem is that these data points sit in separate systems, measured in different units, owned by different teams, and rarely connected into a single view of cause and effect.
When the CFO asks "Was the Q2 promotion profitable?", the answer typically involves weeks of manual analysis, conflicting spreadsheets, and a final number that nobody fully trusts.
A KPI tree solves this by organizing every metric that matters into a single mathematical structure where every number reconciles, every driver is visible, and the answer to "why" is always one branch away.
What a Promo ROI KPI Tree Looks Like
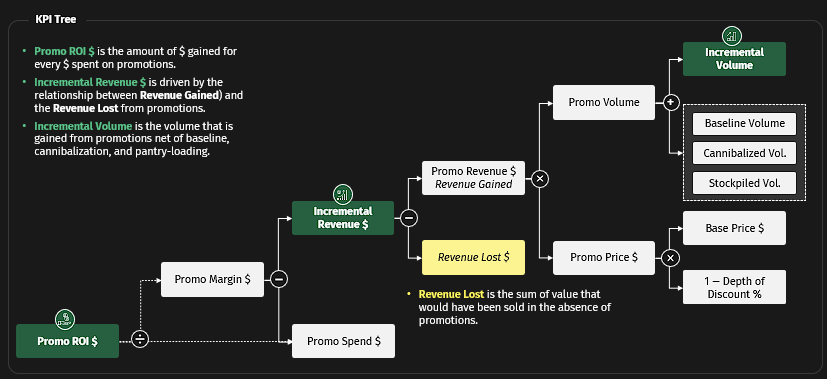
The root metric is Promo ROI, defined as the return generated for every dollar spent on promotions. It decomposes into two direct drivers:
Promo ROI = Promo Margin ÷ Promo SpendPromo Margin is the net financial result of the promotion. It breaks down further:
Promo Margin = Incremental Revenue − Promo SpendIncremental Revenue represents the revenue that would not have existed without the promotion. This is where the analysis gets interesting, because incremental revenue is itself driven by the difference between what was gained and what was lost:
Incremental Revenue = Revenue Gained − Revenue LostEach of these branches continues to decompose until you reach metrics that a specific team can measure, own, and act on.
Revenue Gained: The Volume and Price Story
Revenue gained during a promotion comes from two components:
Revenue Gained = Promo Volume × Promo Revenue per UnitPromo Volume is the total units sold during the promotional period. But not all of that volume is truly incremental. The real question is how much of it would have happened anyway.
Incremental Volume strips out the noise:
Incremental Volume = Promo Volume − Baseline Volume − Cannibalized Volume − Stockpiled VolumeEach subtraction represents a different source of "false" volume:
- Baseline Volume is what would have sold at regular price during the same period. This is the counterfactual that separates real lift from business-as-usual.
- Cannibalized Volume is sales that shifted from other products in your own portfolio. The promotion did not create new demand. It redirected existing demand from one SKU to another.
- Stockpiled Volume is future demand pulled forward. Consumers bought more during the deal and then bought less in the weeks that followed. The promotion shifted timing, not total consumption.
When a category manager sees that a promotion moved 50,000 units, the KPI tree immediately shows how much of that was genuine new demand versus volume that came at the expense of other products or future periods.
Revenue Lost: The Hidden Cost of Every Promotion
This is the branch that most promotion analyses miss entirely, and where a KPI tree adds the most value.
Every promotion sacrifices revenue. Products that would have sold at full price are now sold at a discount. The KPI tree makes this cost visible and traceable:
Revenue Lost = Revenue Lost from Baseline + Revenue Lost from Stockpiling + Revenue Lost from CannibalizationEach component has its own decomposition:
Revenue Lost from Baseline
Revenue Lost from Baseline = Baseline Volume × Base Price of Promoted SKUsThis is the value that would have been generated at non-promoted prices during the promotional event. It represents customers who would have bought anyway, now paying less. Higher baseline volumes and deeper discounts make this number larger.
Revenue Lost from Stockpiling
Revenue Lost from Stockpiling = Stockpiling Volume × Base Price of Promoted SKUsThis captures the post-promotion dip. When consumers stock up during a deal, they buy less afterward. The revenue that would have been generated at full price in the post-promotion period is lost.
Revenue Lost from Cannibalization
Revenue Lost from Cannibalization = Cannibalized Volume × Promo Price of Cannibalized SKUsThis is the value that would have been realized by other SKUs that were not part of the promotional campaign. When a promoted product pulls sales from a non-promoted product in the same category, the net gain for the portfolio is smaller than it appears.
The Price Branch: Depth of Discount
On the price side, the KPI tree decomposes the actual promo price:
Promo Price = Base Price × (1 − Depth of Discount)This simple formula connects pricing strategy directly to promotion economics. A 30% discount does not just reduce price by 30%. It increases the revenue lost from baseline by 30% on every unit that would have sold at full price.
The KPI tree makes this trade-off explicit. Category managers can see exactly how depth of discount flows through to Promo ROI, and at what point a deeper discount destroys more value than the incremental volume it generates.
Why This Structure Changes the Conversation
From "Did it work?" to "What drove the result?"
Without a KPI tree, a promotion review meeting sounds like this: "We sold 50,000 units, up 40% versus last year. The promotion worked." With a KPI tree, the same meeting sounds like this: "We sold 50,000 units. 18,000 were baseline. 7,000 were cannibalized from adjacent SKUs. 5,000 were stockpiled from the following period. True incremental volume was 20,000 units. At a 25% discount depth, the revenue gained net of revenue lost was $120K on $95K of spend, for a Promo ROI of 1.26."
The second conversation leads to better decisions because every number traces back to a specific driver that someone can influence.
From Annual Reviews to Weekly Decisions
Static promotion post-mortems happen once a quarter at best. A KPI tree connected to live data shows Promo ROI moving in real time. If cannibalization is spiking during the first week of a four-week promotion, the team can adjust assortment, messaging, or display placement before the full budget is consumed.
From Category Silos to Portfolio Thinking
The cannibalization branch is the key. Most category teams optimize their own promotions in isolation. A KPI tree that includes cross-category cannibalization forces portfolio-level thinking. The question changes from "Did my promotion work?" to "Did my promotion create net new value for the business?"
Building the Tree: Practical Steps for CPG Teams
Step 1: Define the North Star
Start with Promo ROI or Promo Margin as the root metric. Both work. Promo ROI normalizes by spend and makes it easier to compare promotions of different sizes. Promo Margin shows absolute value creation.
Step 2: Map the First Level
Break the root into its direct mathematical drivers. Use actual formulas, not correlations. The tree should reconcile perfectly: if you multiply or add all child nodes, you get the parent.
Step 3: Decompose Volume and Price
This is where CPG-specific knowledge matters. The distinction between baseline, cannibalized, and stockpiled volume is not generic analytics. It comes from understanding how consumers actually respond to promotions in grocery, convenience, and mass retail.
Step 4: Quantify Revenue Lost
This is the step most teams skip. Building the revenue-lost branch requires counterfactual estimates (what would have sold without the promotion) and cross-SKU analysis (which products lost share during the event). Both are challenging but essential for accurate ROI.
Step 5: Connect to Decisions
Every leaf node should connect to a decision someone can make. Baseline volume connects to demand planning. Cannibalization connects to assortment strategy. Depth of discount connects to pricing policy. Stockpiling connects to promotional timing and frequency.
Common Mistakes in Promotion Analysis
Counting Gross Volume as Success
A promotion that moves 100,000 units looks impressive until the tree shows that 60,000 were baseline, 15,000 were cannibalized, and 10,000 were stockpiled. The real lift was 15,000 units, barely enough to cover the trade spend.
Ignoring Revenue Lost
If you only measure what was gained and never what was sacrificed, every deep discount looks brilliant. The revenue-lost branch corrects this bias by showing the full cost of the promotional price in explicit dollar terms.
Optimizing Single SKUs Instead of Portfolios
A promotion on Product A that cannibalizes $200K from Products B and C is not a good promotion, even if Product A shows strong lift. The KPI tree makes portfolio impact visible at every level.
Never Measuring Post-Promotion Dip
If stockpiled volume is not quantified, teams overestimate incremental impact by counting demand that was simply pulled forward. The KPI tree includes this as a distinct, measurable branch.
From Trade Promotion Optimization to KPI Tree Thinking
Trade Promotion Optimization (TPO) is one of the most discussed and least solved problems in consumer goods. The frameworks exist. The data exists. What is usually missing is a structure that connects spend to outcome through a clear chain of drivers.
A KPI tree provides that structure. It does not replace TPO software or syndicated data. It organizes the outputs of those systems into a single visual that answers the question every commercial leader asks: where did the money go, and was it worth it?
For a deeper understanding of how KPI trees work across industries, read our complete guide to KPI trees.
---
Build your own Promo ROI KPI tree with kpitree.io and turn trade promotion analysis from a quarterly exercise into a decision-making system.